Ultramarathon Analysis
On March 29, 2025, I ran my first ultramarathon, a 50K race along Chicago’s scenic lakefront trail. It was my first time running further than the marathon distance, and I made it to the finish line!
Since I love digging into data, I naturally downloaded the official race results and registration data to explore who ran the race and how we all performed. This blog shares some of the insights I uncovered.
⚡ Key Takeaways (TLDR)
1. Age isn’t a limitation, it’s an asset: Some of the most consistent and fastest finish times came from runners in their 30s, 40s, and even 50s. Men, in particular, showed remarkable consistency, with average finish times staying within a 30-minute range across ages 18 to 59.
2. Women hold their ground: Despite making up just a third of participants, women had a slightly higher completion rate and performed competitively across age groups. While small sample sizes limit broad conclusions, the data suggests women are more than capable of keeping pace with their male counterparts.
3. Variability reveals the deeper story: Looking beyond averages to examine variance, skewness, and distribution helps uncover the real dynamics of the race.
📊 Who Showed Up and Finished?
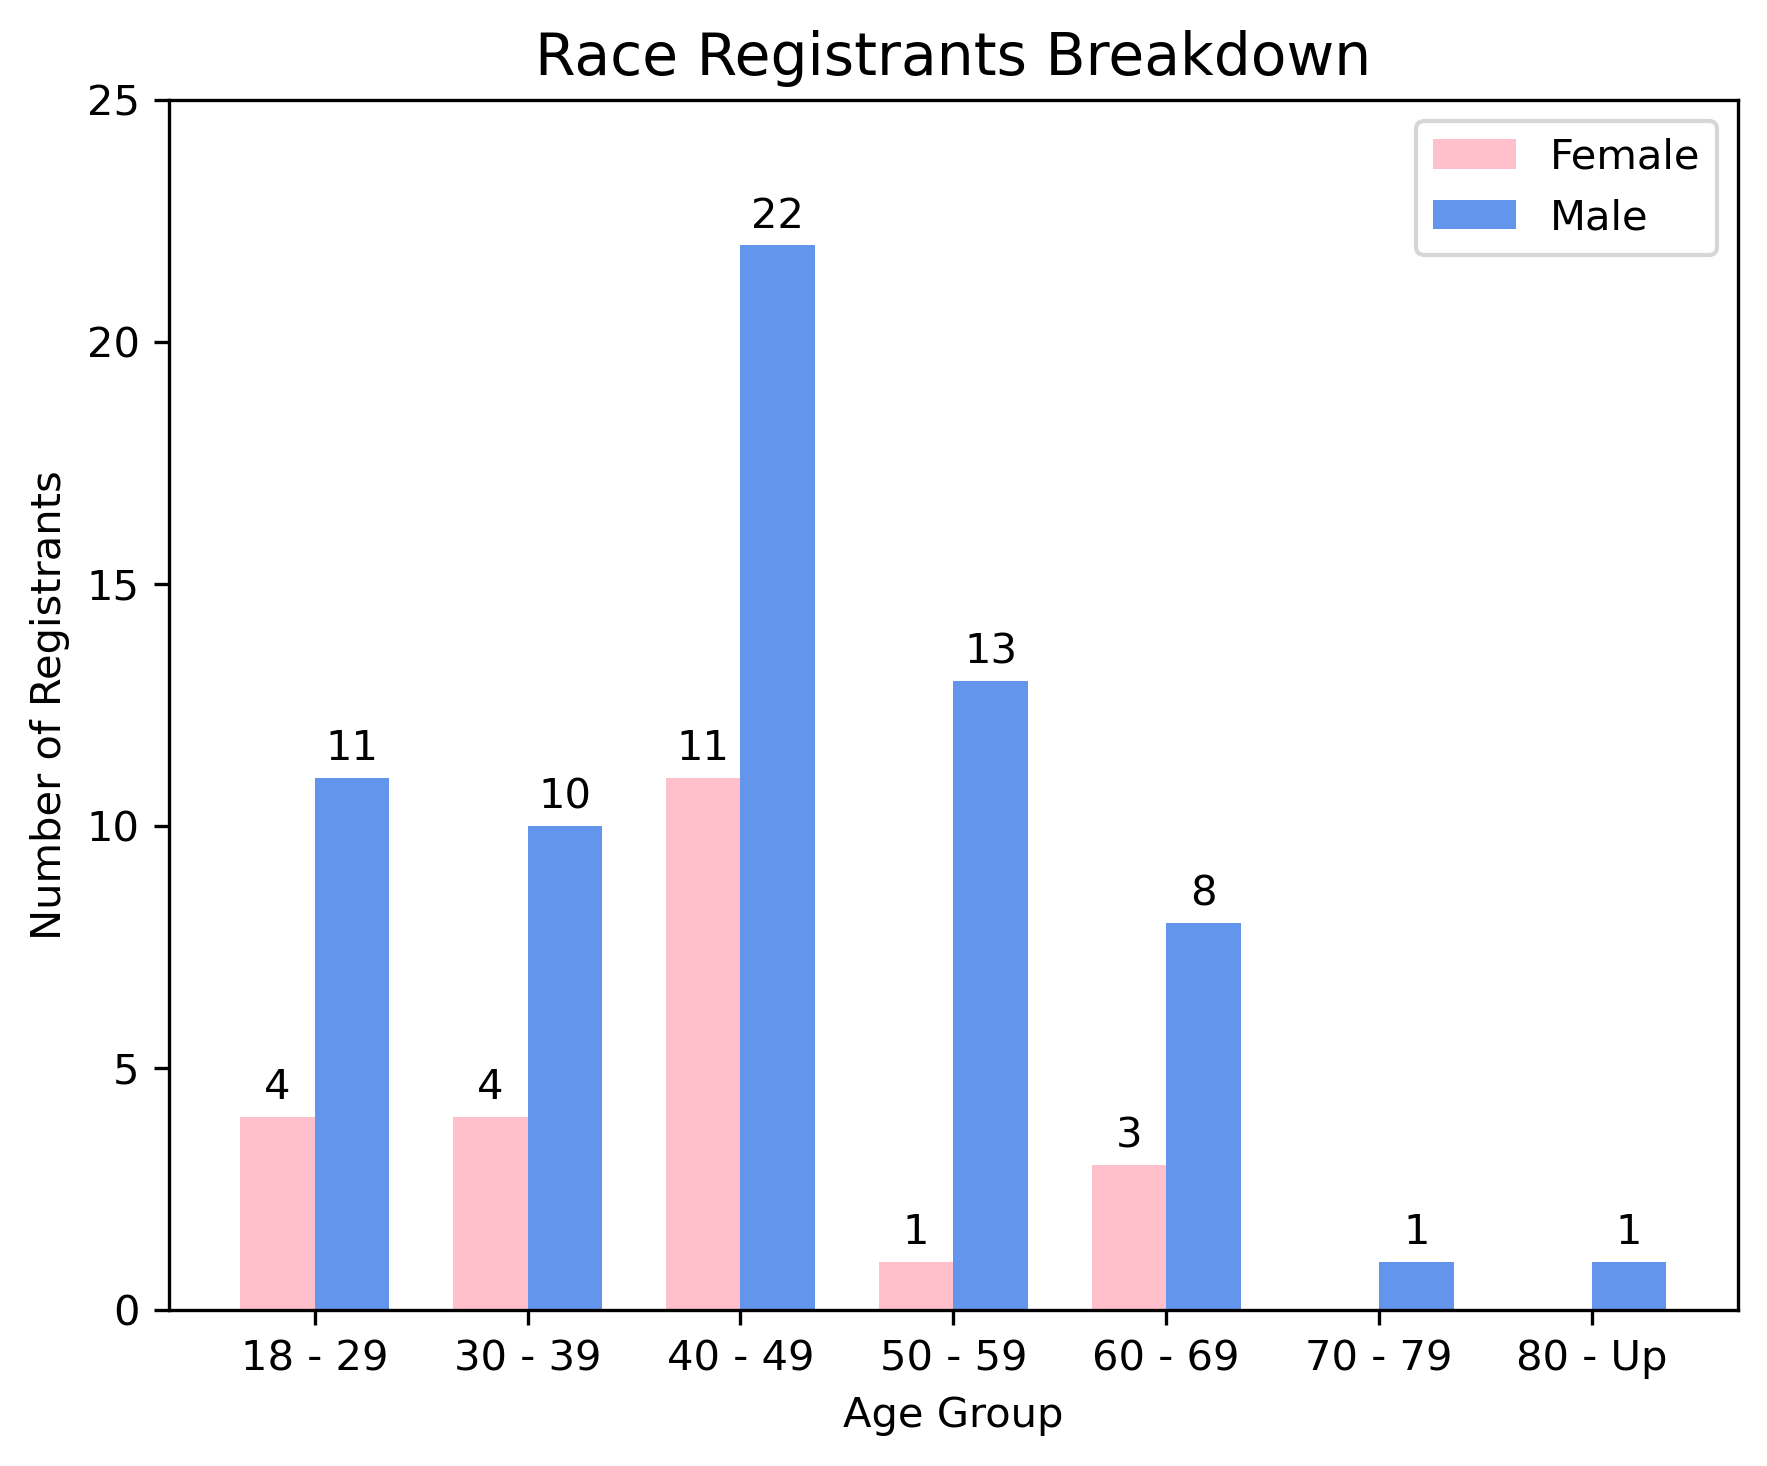
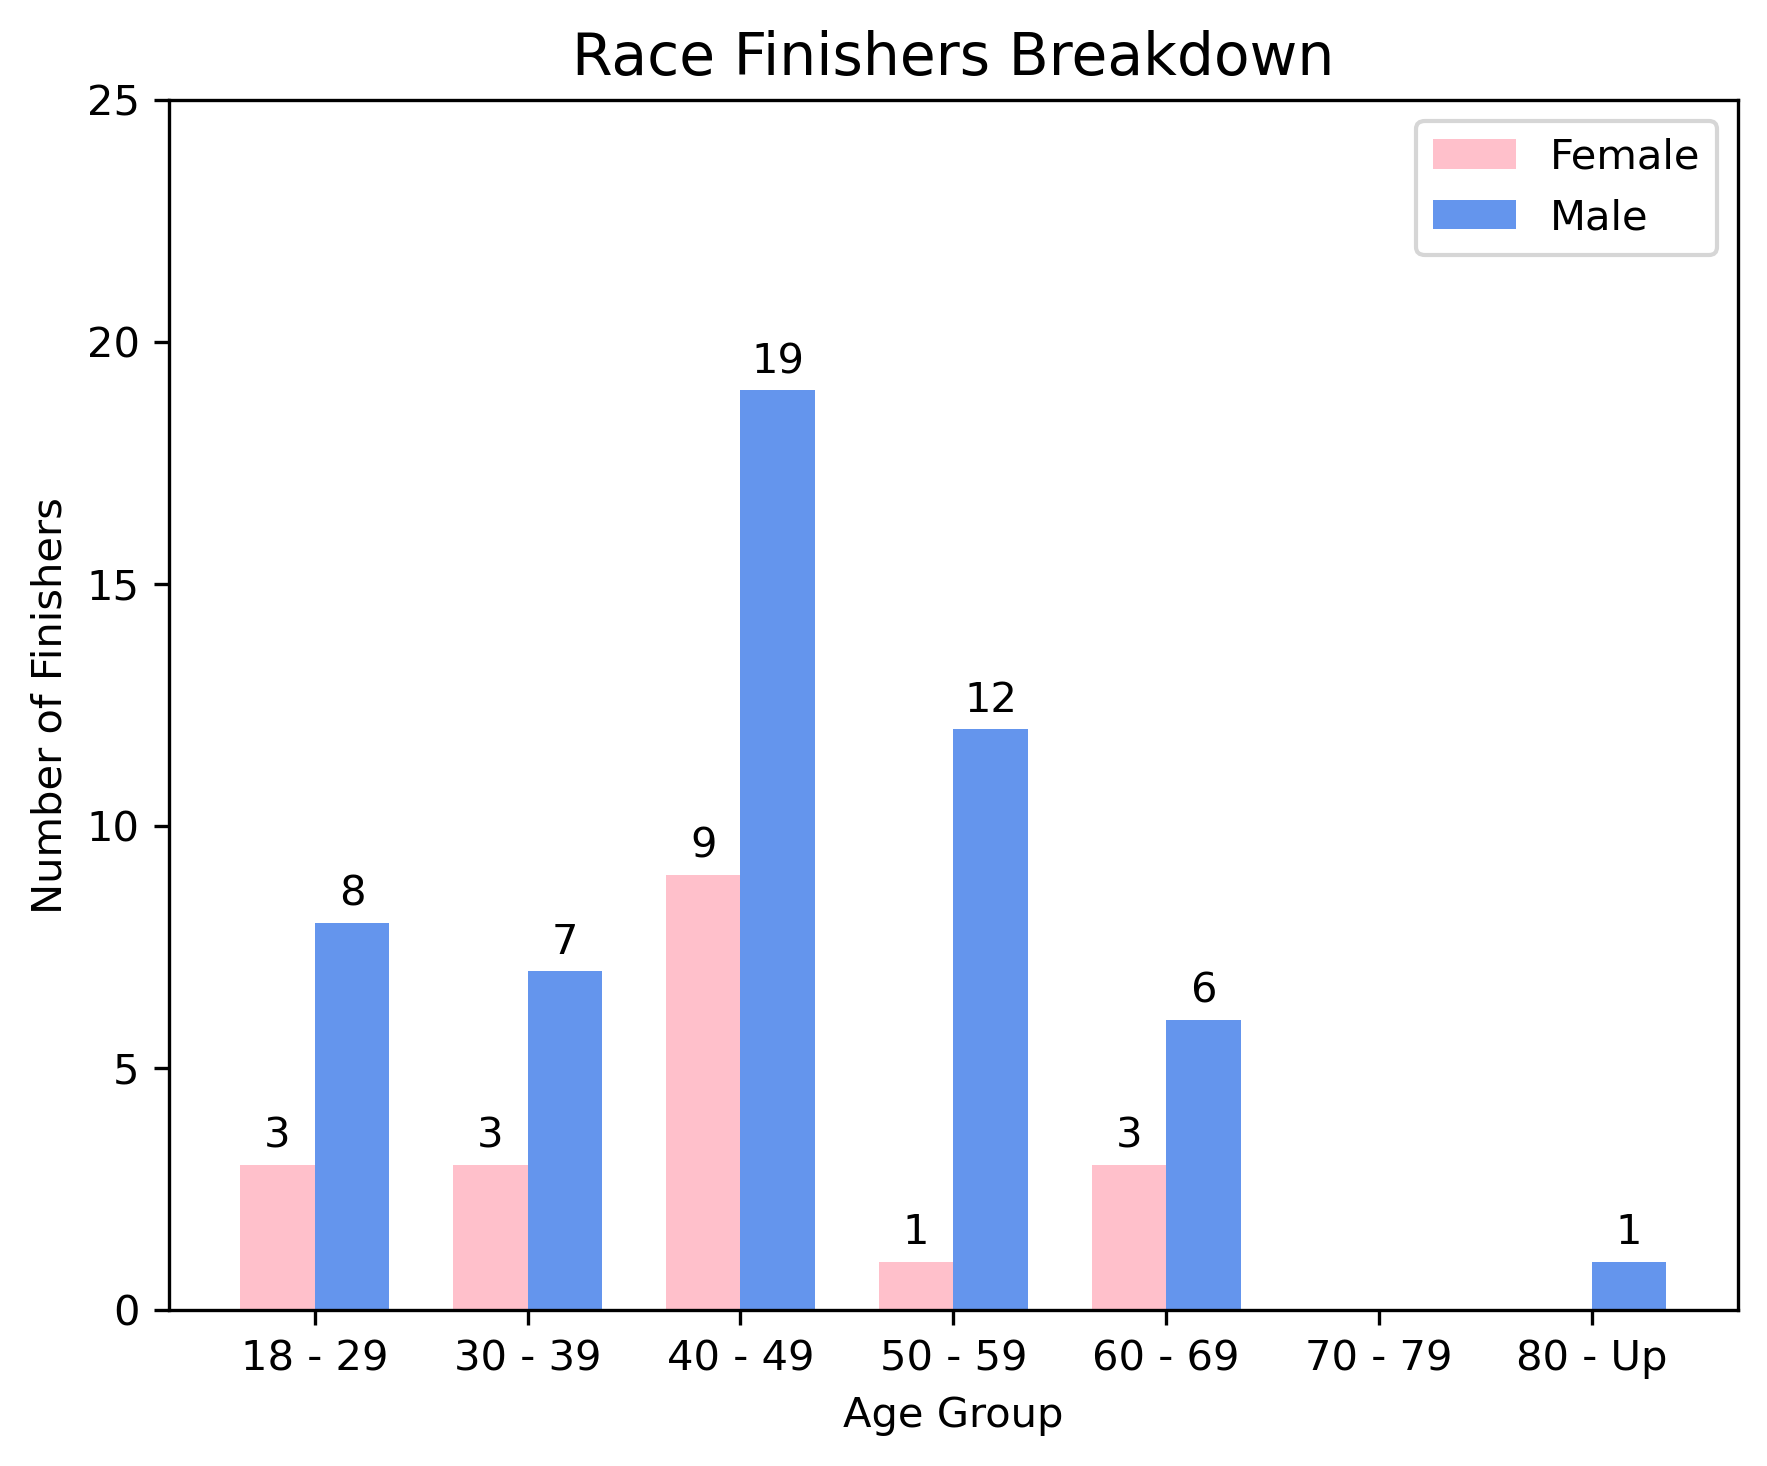
This year, 89 people registered for the race, and 72 crossed the finish line. The largest age group represented was 40–49, which accounts for 37% of all participants (33 out of 89). Ultrarunning continues to be male-dominated, with men outnumbering women by about 2 to 1. This pattern was consistent across all age groups but especially noticeable among younger runners (18–39).
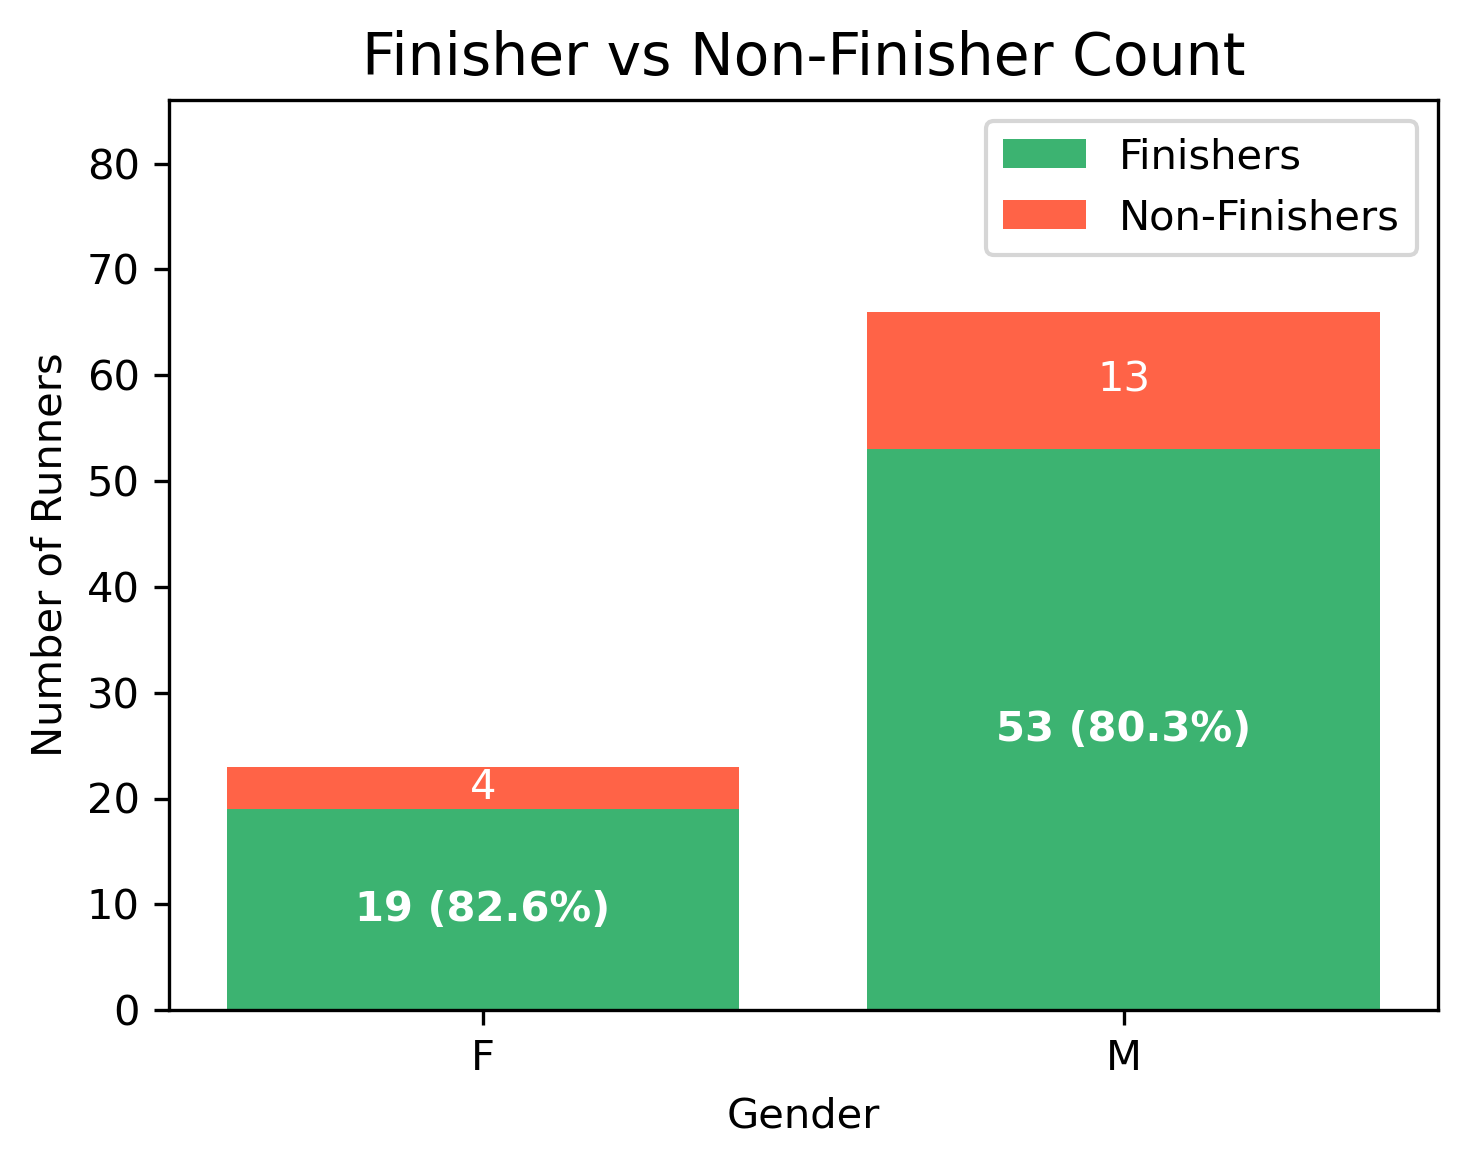
Despite this, women had a slightly higher completion rate: 82% vs. 80% for men. While the difference is small, it speaks to the grit and determination of the female runners. That said, I’d like to do more research to see how an 80% finish rate compares to other endurance events, like marathons or similar ultra races.
🕒 How Fast Did People Run?
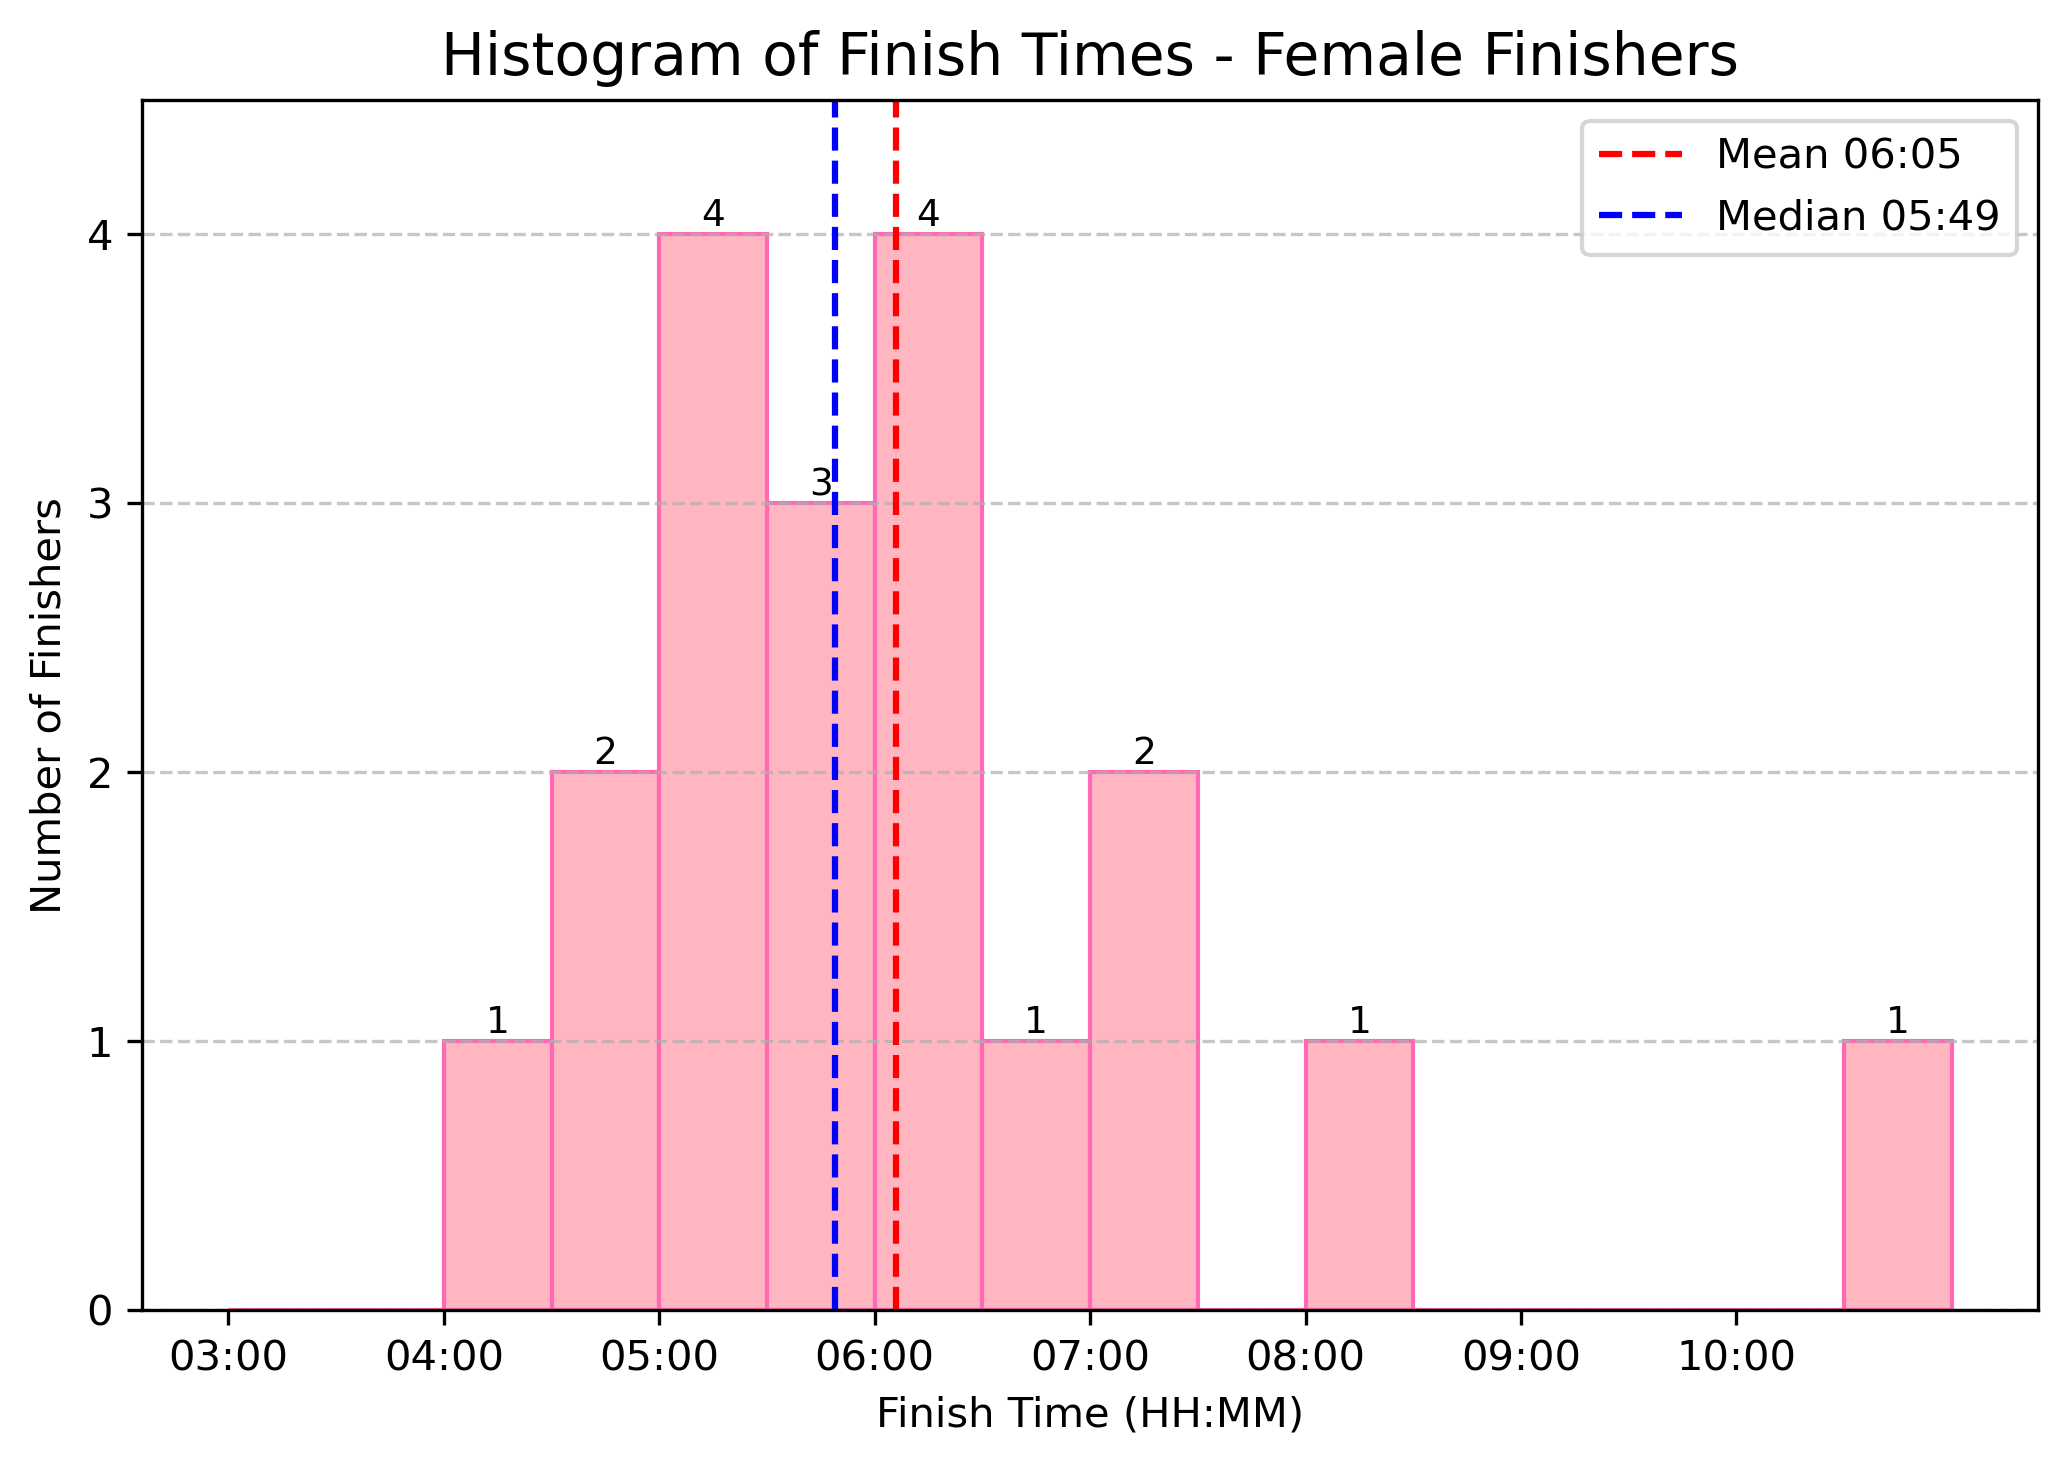
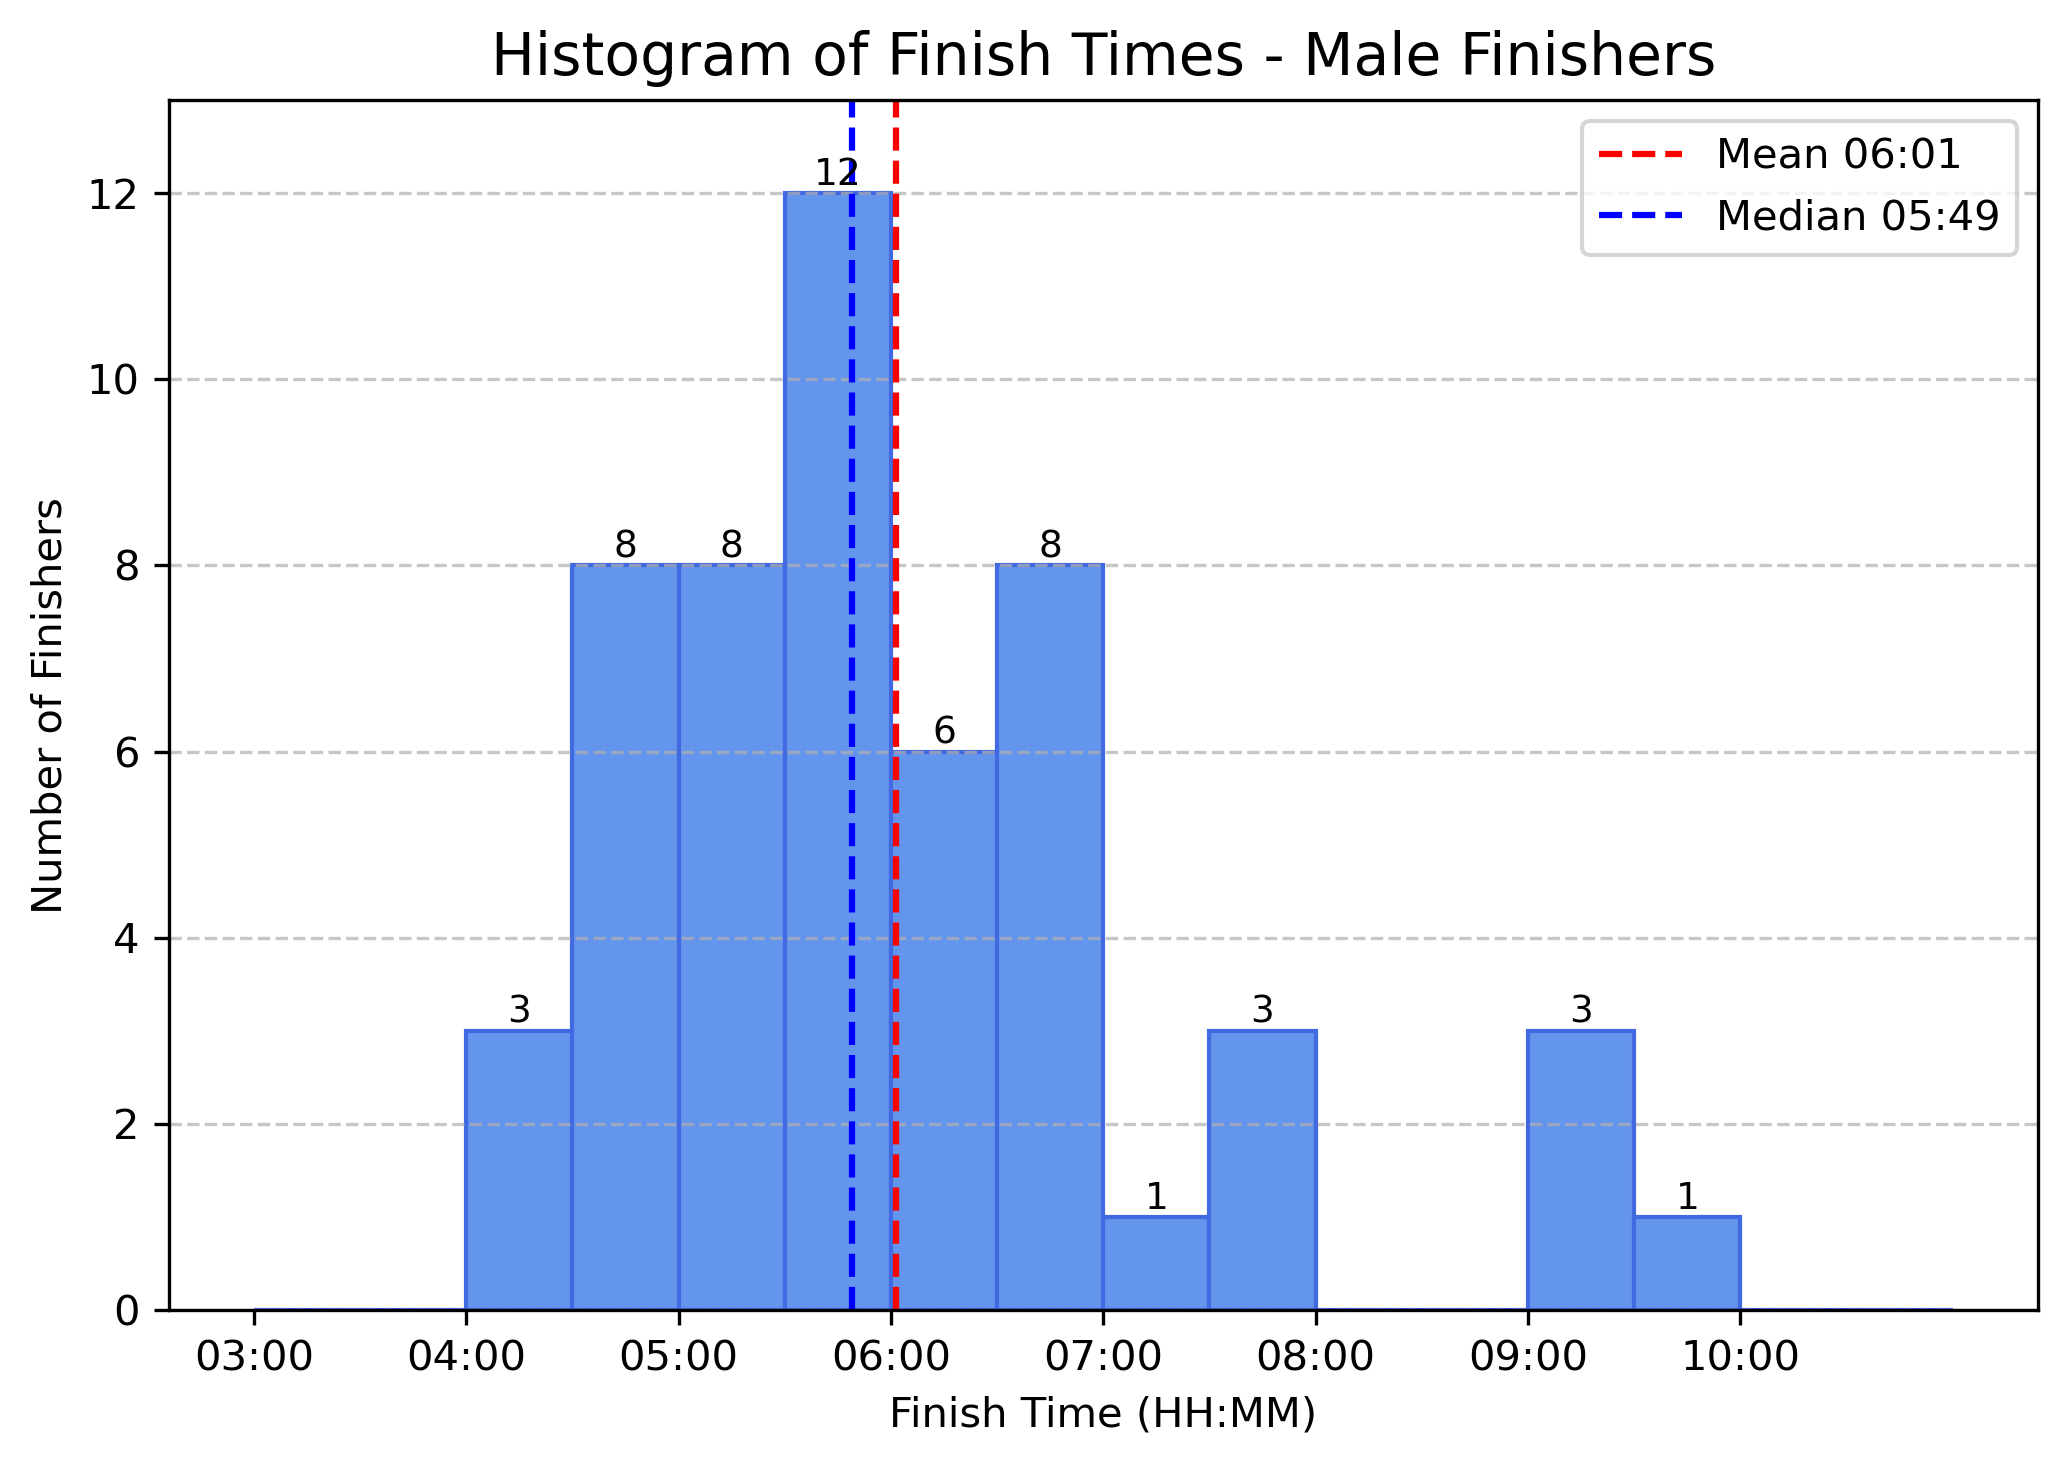
Surprisingly, both men and women had the same median finish time: 5 hours and 49 minutes. What are the odds?
When looking at average finish times, men finished slightly faster (6:01 vs. 6:05 for women). The 4-minute difference is small and could be due to pacing strategies, experience, or external factors like weather.
⚖️ Why Standard Deviation Matter More Than Just Averages
The spread of finish times offers more insight than averages alone. The standard deviation for women was 1 hour and 31 minutes, compared to 1 hour and 18 minutes for men. This indicates a broader range of performance among female runners.
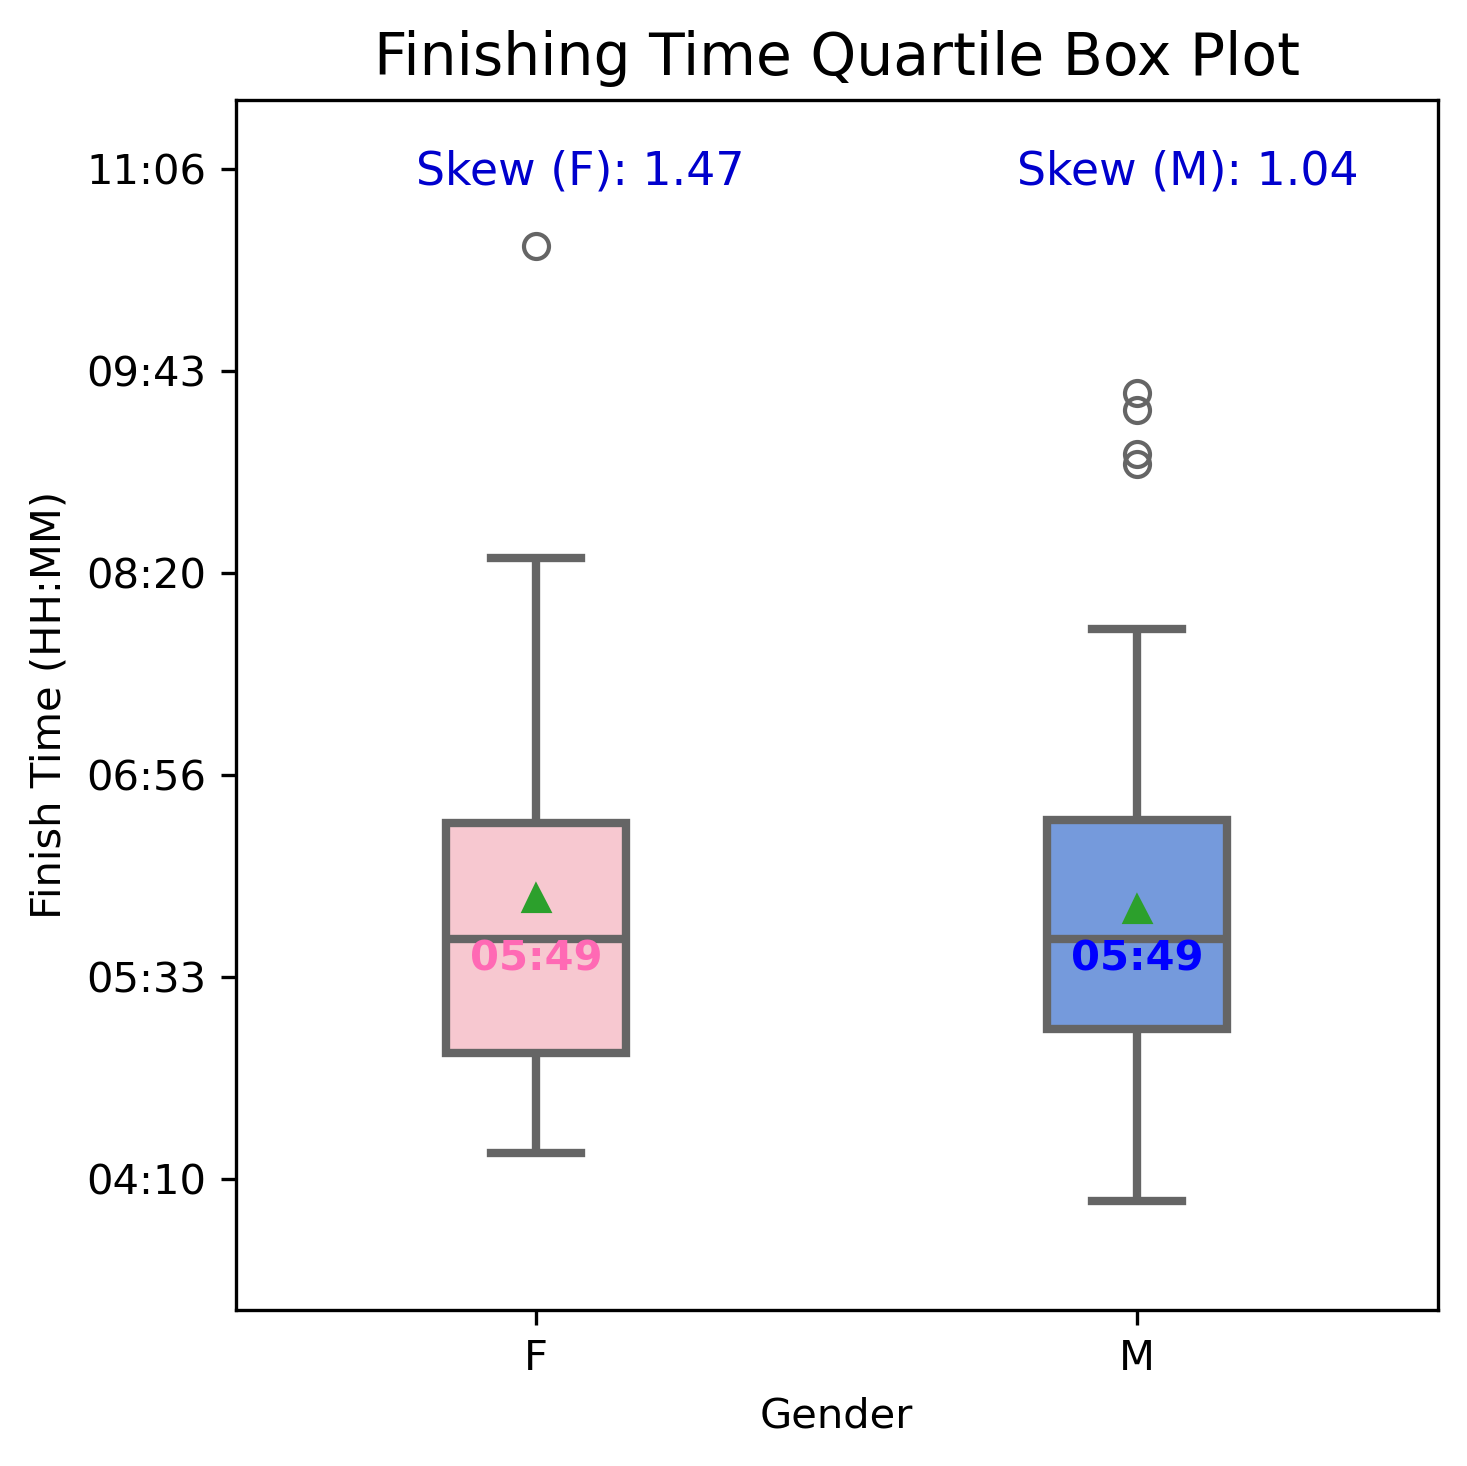
Box plots help visualize this spread. Women’s finish times skewed more toward the slower end—their upper whisker extended far past the third quartile. Men’s results were more evenly distributed.
Sample skewness quantified this: 1.47 for women and 1.04 for men. Both distributions are right-skewed, but women’s results were more asymmetric. Histogram charts reinforce this, with both distributions leaning toward slower runners.
In plain terms, women had a wider range of finish times, while men were more tightly clustered around the average. This could reflect a broader spectrum of goals, experience, or pacing strategies among female participants.
📊 Age and Performance
Let’s dig into finish times by age group.
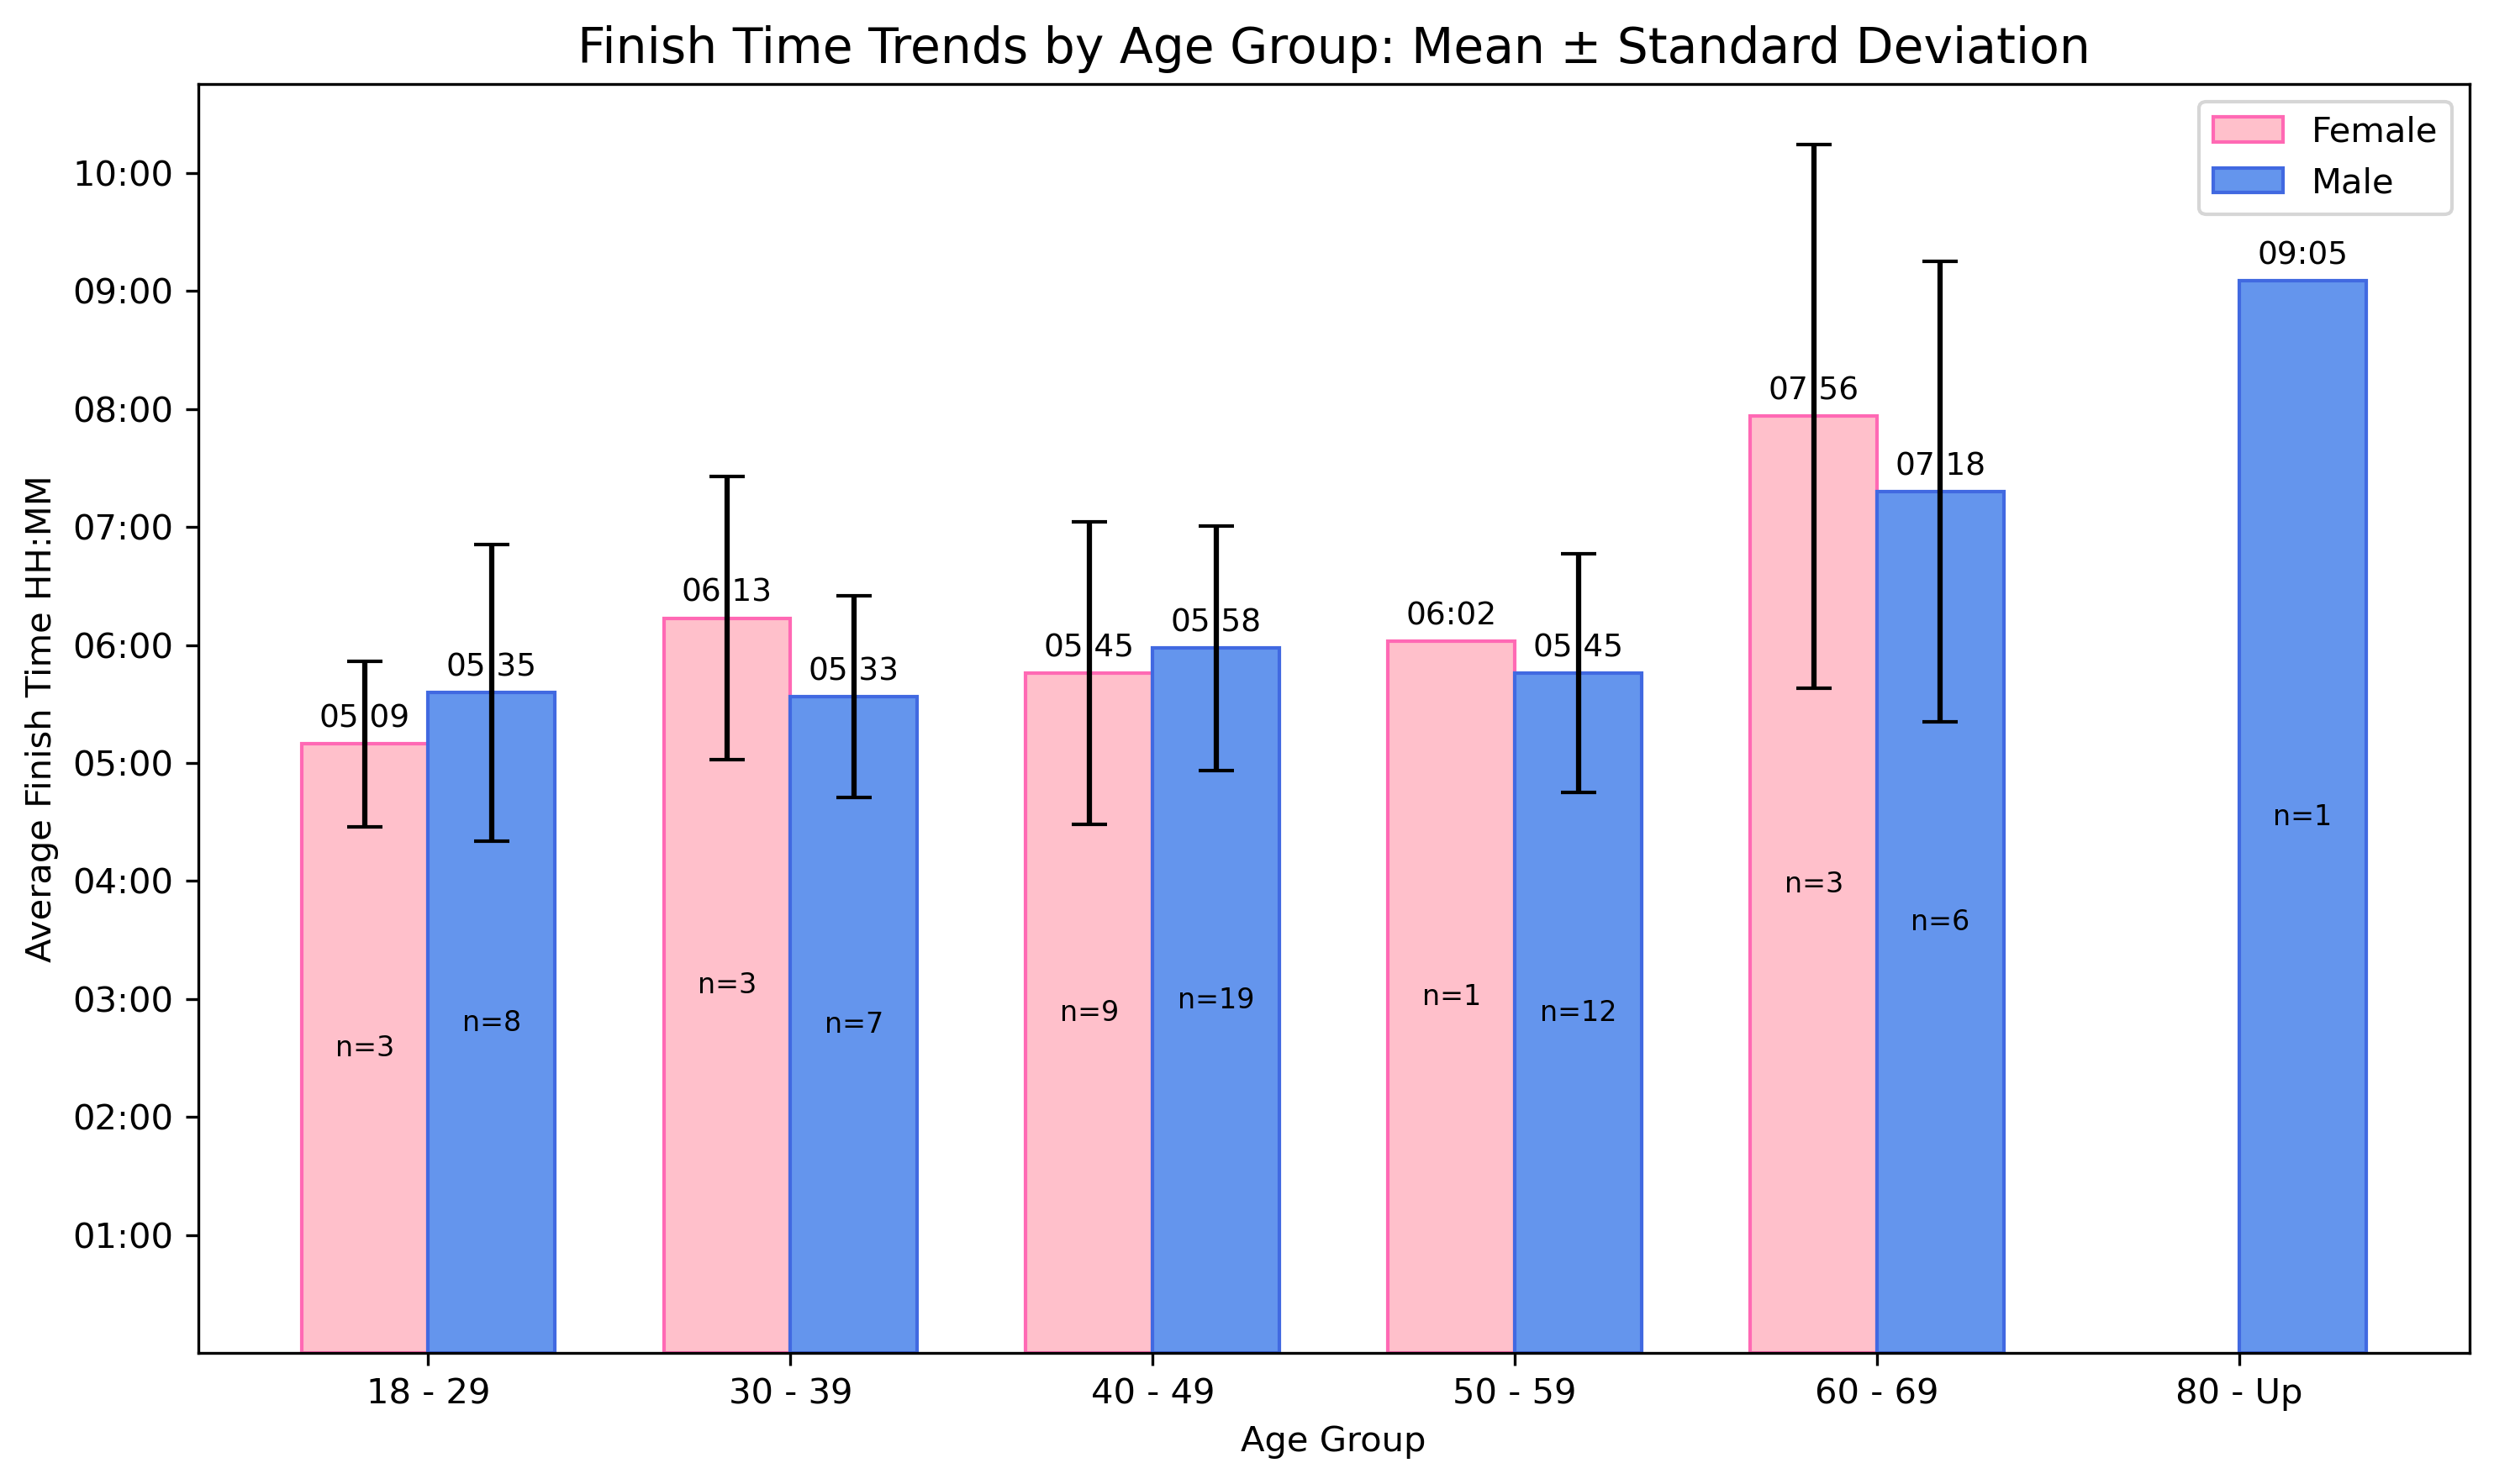
For men, performance was remarkably consistent. From ages 18 to 59, average finish times stayed within a 30-minute window: 5:35 to just under 6:00. The 30–39 age group was fastest (5:33), followed by 18–29 (5:35) and 50–59 (5:45).
Women showed greater variation—nearly an hour difference across the same age span. But some age groups had fewer than five participants, so conclusions should be cautious.
The takeaway? Youth doesn’t guarantee speed. In ultra-distance races, experience, mindset, and strategy often matter more than raw physical ability. Many of the most consistent and fastest runners were in their 40s and 50s.
🎻 Bonus: Exploring Distribution with Violin Plots
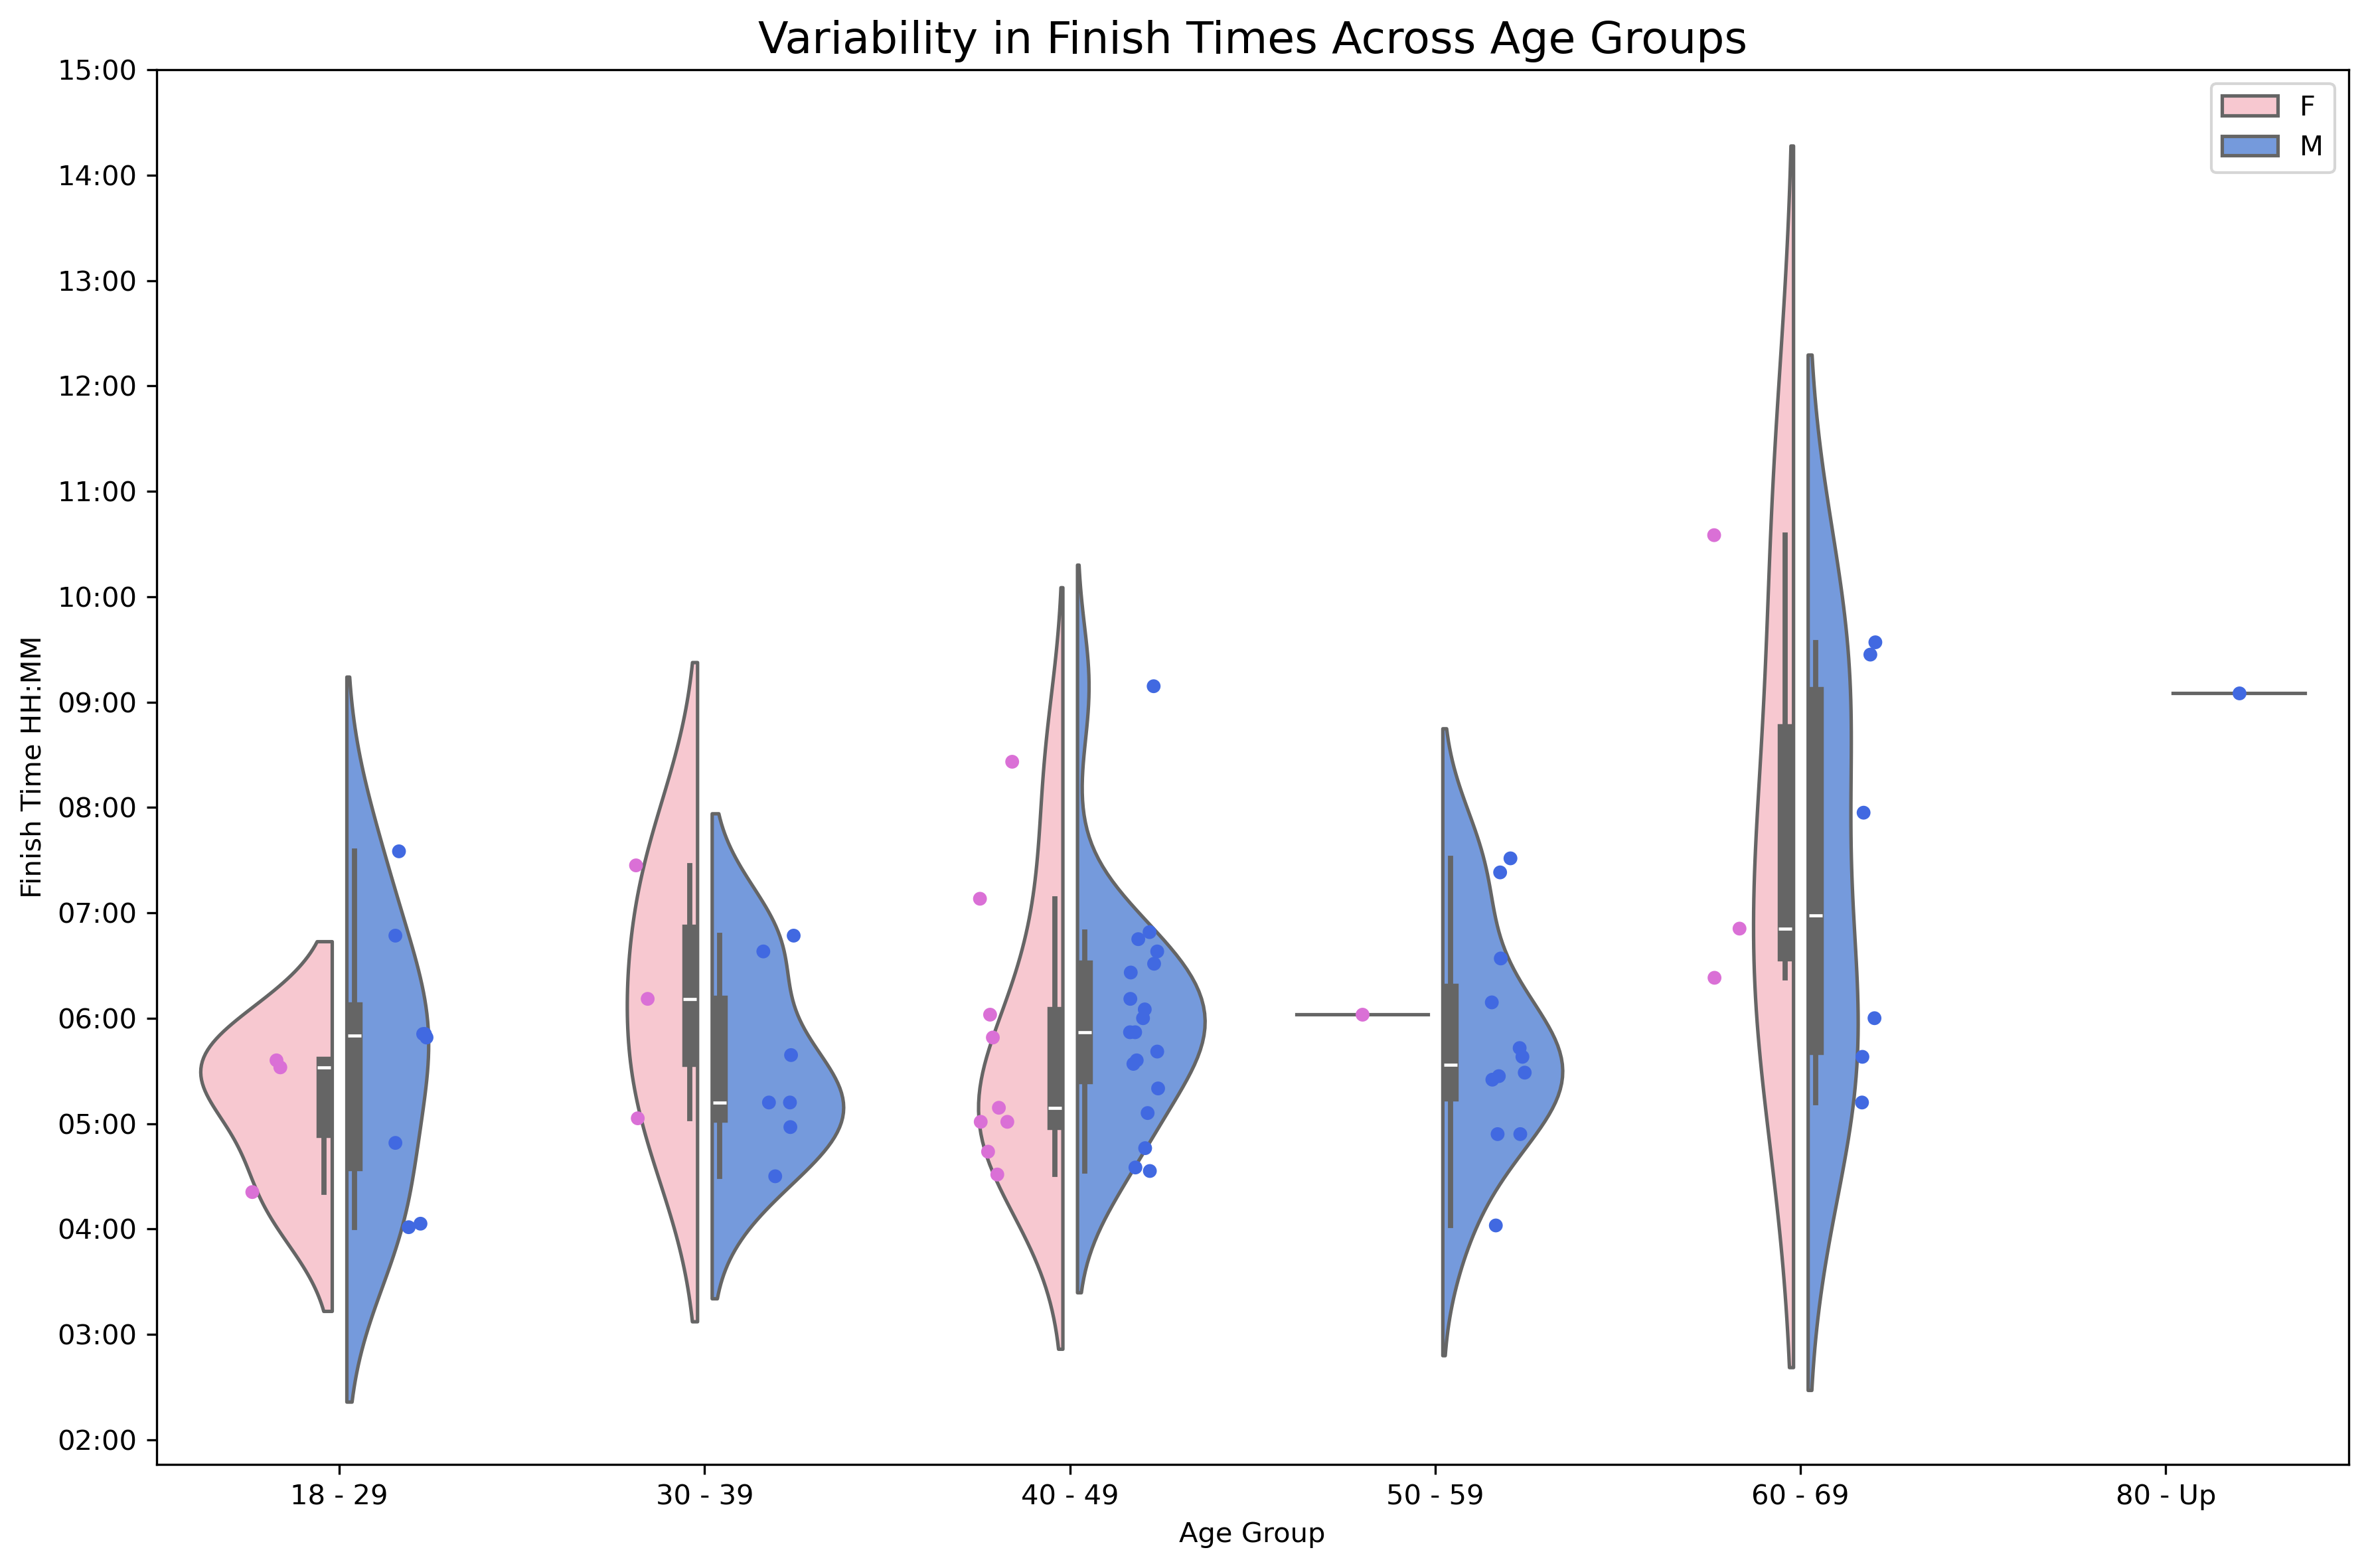
To better understand variability, I used violin plots, which combine boxplots with mirrored density curves to show both spread and shape.
Interesting patterns emerged:
- Men aged 30–39 had the most consistent performance. Their finish times were tightly clustered with minimal spread.
- The 30s, 40s, and 50s male groups all showed bimodal distributions, with most finishing around the mean and a few individuals finishing much slower.
- Younger men (18–29) had more variance than their older peers. This was unexpected, given their physiological advantage.
- Women aged 18–29 had one of the narrowest distributions, while performance variability increased with age. This may be due to a very small sample size (3 participants).
Beyond age 50, both male and female finish times stretched out. Some runners were still zipping along, but many took longer to finish. The sole male finisher in the 80+ age group completed the race in 9 hours and 5 minutes. You have my deepest respect.
💭 Final Thoughts and Discussion
- It’s encouraging to see that, despite being underrepresented, women showed remarkable grit, finishing at a slightly higher rate than men. That resilience stands out in a field still largely dominated by male runners.
- I expected men to be faster overall due to both physiological factors and the sport’s male-skewed participation. While the data confirmed a slight edge in men’s finish times, I was glad to see the gap was small and women performed competitively across multiple age groups.
- What really surprised me was how strong the 40s and 50s divisions were overall. Some of the most consistent and fastest times came from these age groups—proving that in ultra-distance running, experience and endurance often beat youth.
What stood out to you? Did anything surprise you? I’d love to hear your thoughts!
I conducted the analysis in Python, using pandas, seaborn, and matplotlib. If you’re curious to see the code or run the notebook yourself, you can check it out on my GitHub.